

Buy a delivery van for GHS 240,000 and, the moment it leaves the dealership, it is no longer worth GHS 240,000. Three years later it might be worth a third of that. Depreciation is simply the accounting word for that decline: the way you spread the cost of an asset across the years it actually earns its keep, rather than pretending the whole expense landed in the month you paid the invoice. It is one of the least glamorous topics in finance and, judging by how often it is misunderstood, one of the most quietly expensive to get wrong.
The confusion is rarely about the concept. Everyone accepts that things wear out. The confusion is about the arithmetic, the vocabulary, and the fact that two organisations can look at the identical GHS 240,000 van and record wildly different values for it in the same year, both correctly. This article strips out the jargon and walks through the two methods you will meet most often, with numbers you can follow on a single sheet of paper.
Why depreciation exists at all
Imagine you record the full GHS 240,000 as an expense the day you buy the van. Your accounts show a catastrophic month followed by five years of the van magically costing nothing, even though it is hauling goods and generating revenue the entire time. That is not a fair picture of the business. Depreciation fixes the mismatch by matching a slice of the cost to each period the asset is used, so profit reflects reality and the balance sheet shows what you still own.
There is a practical dimension too. Tax authorities, including the Ghana Revenue Authority, allow you to deduct capital allowances that broadly follow depreciation logic, and lenders read your balance sheet to judge what your assets are worth as security. An asset register full of items still valued at their original purchase price, years after they were bought, is a register nobody trusts.
The three numbers every method needs
Before any calculation, you need three inputs, and getting them from a clean register is half the battle. The cost is what you paid, including delivery and installation. The useful life is how many years you expect the asset to serve, which is a judgement, not a fact handed down from above. The residual value (also called salvage or scrap value) is what you expect to sell it for at the end of that life. A laptop might have a useful life of four years and a residual value of near zero; a generator might run for ten years and still fetch a decent resale price.
None of these three is as objective as it looks, and that is where most disputes begin. Cost seems obvious until you remember the clearing agent, the delivery to site, and the electrician who wired in the generator, all of which belong in the figure rather than buried in a separate expense. Useful life is an honest estimate shaped by how hard you run the asset and the climate it sits in, not a number copied from the manual. Get these inputs wrong at the start and every year of the schedule inherits the error, which is why a few minutes of care here saves a great deal of correction later.
Method one: straight-line depreciation
Straight-line is the method most people picture when they hear the word. You take the cost, subtract the residual value, and divide by the useful life. That gives you the same depreciation charge every single year until the asset is written down to its residual value. It is popular because it is simple to explain, simple to audit, and it suits assets that wear out evenly, like office furniture or building fit-out.
Take our GHS 240,000 van with a residual value of GHS 30,000 and a useful life of six years. Subtract the residual from the cost to get GHS 210,000 of value to spread. Divide by six and you get an annual charge of GHS 35,000. Every year, without fail, GHS 35,000 comes off the book value. After year one the van is worth GHS 205,000; after year three, GHS 135,000; after year six it sits at its residual value of GHS 30,000, and depreciation stops.
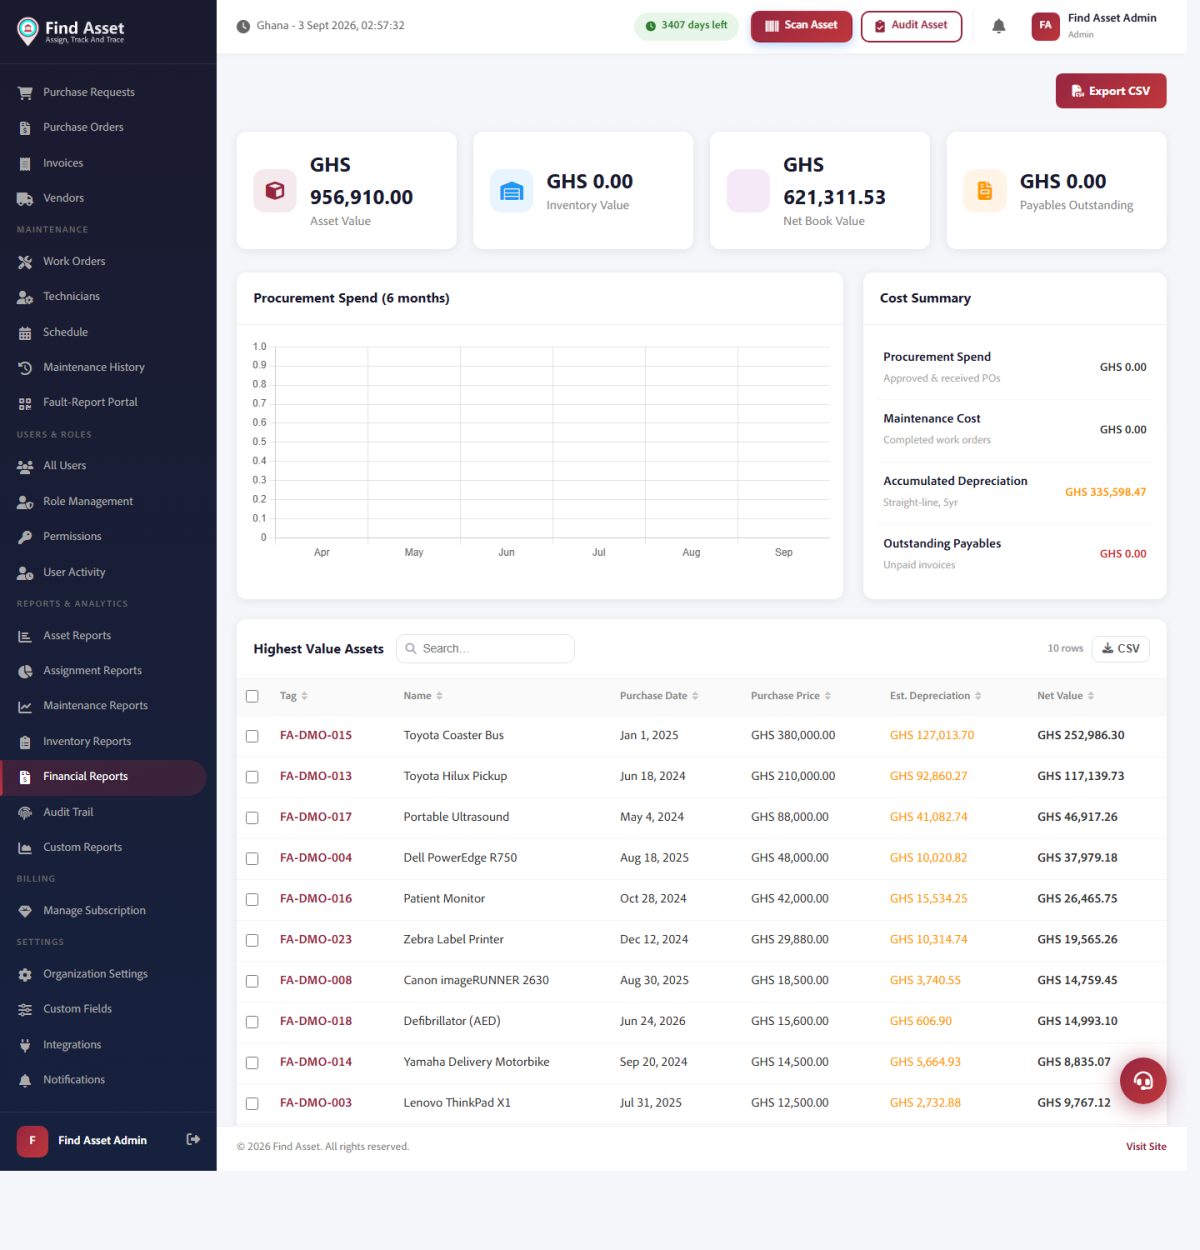
Depreciation is only meaningful against a recorded value. Find Asset's financial reports (above) hold each asset's original cost and current book position, so the theory in this article maps onto numbers the system is already tracking for you.
Method two: reducing-balance depreciation
Reducing-balance (sometimes called declining-balance or diminishing-value) takes a different view. Instead of a fixed amount, you apply a fixed percentage to whatever the asset is currently worth. Because the book value shrinks each year, so does the charge. The result is a big deduction early and progressively smaller ones later. This matches the real behaviour of assets like vehicles, laptops, and machinery, which lose most of their value in the first couple of years.
Apply a 30% reducing-balance rate to the same van. Year one takes 30% of GHS 240,000, which is GHS 72,000, leaving a book value of GHS 168,000. Year two takes 30% of GHS 168,000, which is GHS 50,400, leaving GHS 117,600. Year three takes 30% of that, GHS 35,280, and so on. Notice the charge falls every year even though the percentage never changes. The asset never quite reaches zero on paper, which is why reducing-balance is usually paired with a rule to write off the small remainder at disposal.
Seeing both methods side by side
The clearest way to feel the difference is to lay the two schedules against each other on the identical van. Watch how straight-line stays flat while reducing-balance front-loads the pain.
| Year | Straight-line charge | Straight-line book value | Reducing-balance (30%) charge | Reducing-balance book value |
|---|---|---|---|---|
| Start | — | GHS 240,000 | — | GHS 240,000 |
| 1 | GHS 35,000 | GHS 205,000 | GHS 72,000 | GHS 168,000 |
| 2 | GHS 35,000 | GHS 170,000 | GHS 50,400 | GHS 117,600 |
| 3 | GHS 35,000 | GHS 135,000 | GHS 35,280 | GHS 82,320 |
| 4 | GHS 35,000 | GHS 100,000 | GHS 24,696 | GHS 57,624 |
Both methods eventually account for the fall in value; they just disagree about the timing. Straight-line spreads it evenly, which flatters your early profits. Reducing-balance takes the hit early, which lowers early profit but arguably reflects the true market value of a two-year-old van far more honestly. Neither is more "correct" in the abstract. The right choice depends on how the asset actually behaves and what your accounting policy specifies.
Choosing the method that fits the asset
A sensible rule of thumb: use straight-line for assets that deliver steady service across their life and hold value gradually, such as furniture, fittings, and buildings. Reach for reducing-balance when an asset loses value fast and unevenly, such as company vehicles, laptops, phones, and production machinery. Whatever you choose, apply it consistently within each asset class and document the policy, because switching methods to massage a profit figure is exactly the kind of thing an auditor is trained to spot.
It is worth being honest about why the choice matters beyond bookkeeping tidiness. The method you pick changes the profit you report in the early years, and that reported profit feeds the tax you pay, the ratios a lender studies, and the bonus a manager might chase. Front-loading depreciation on a fleet of vehicles suppresses early profit but leaves you with cleaner, more realistic book values when you come to sell. Choosing the method to match how the asset genuinely behaves, rather than the number you would like to show this quarter, is what keeps the register defensible when someone asks hard questions.
Depreciation done properly
- Record cost, useful life, and residual value for every asset before you calculate anything.
- Pick straight-line for even-wear assets and reducing-balance for fast-depreciating ones.
- Apply the same method consistently within an asset class, and write the policy down.
- Recalculate book values on a schedule, not once and never again.
Where the register meets the numbers
Every calculation above assumes you actually know what you own, when you bought it, and what you paid. That is a bigger assumption than most organisations would like to admit. If your purchase dates live in one spreadsheet, your costs in another, and half your assets were never logged at all, no depreciation method will save you, because the inputs are wrong before the arithmetic begins. A single, accurate fixed asset register is the foundation the whole exercise stands on.
The link runs both ways, which is what people miss. A depreciation schedule is not just an output of the register; it is one of the best tests of whether the register is honest. When you sit down to recalculate book values and find assets with no purchase date, three entries that look like the same generator, or items still carrying value years after they were scrapped, the exercise has just done you a favour by exposing the gaps. Treat the annual depreciation run as a health check on your data, not merely a figure for the accounts, and the register gets cleaner every year instead of quietly rotting.
Common mistakes worth avoiding
The most frequent error is forgetting residual value and depreciating an asset all the way to zero when it clearly still has resale worth. The second is guessing useful life to suit the tax outcome rather than the engineering reality. The third, and most damaging over time, is treating depreciation as an annual box-ticking chore instead of a live figure. When assets are added, transferred, or disposed of throughout the year and nobody updates the register, the closing book values are fiction by December. Depreciation is only as trustworthy as the movement data feeding it, which is why sound tracking habits matter as much as the formula itself.
It also pays to separate depreciation from maintenance in your thinking. An asset that is depreciating on schedule can still be quietly draining cash through repairs, and the two together give you the real cost of ownership. Reading depreciation alongside your maintenance records is how you decide whether to keep running an ageing machine or replace it.
Bringing it together
Strip away the vocabulary and depreciation is just honest bookkeeping about the fact that things wear out. Straight-line spreads the cost evenly; reducing-balance front-loads it to match how fast the asset really loses value. Neither is difficult once you have the three inputs and a register you can trust, and both fall apart the moment that register is out of date. The hard part was never the arithmetic; it was keeping the underlying data clean enough for the arithmetic to mean anything.
Keeping those inputs honest is the product's whole job: Find Asset captures purchase cost, dates, custodians and disposals as they happen, so your depreciation figures rest on facts rather than guesswork. If you would like to see your own numbers calculated from a register that stays current, start a free 14-day trial. For the accounting background, the overview of depreciation is a solid reference too.