

It is oddly easy to measure everything about your assets and understand almost nothing. A modern register can produce dozens of figures on demand — counts, values, ages, locations, movements — and a dashboard will happily display all of them at once. The problem is not a shortage of numbers. It is that most of those numbers never change a single decision, and a metric that changes no decision is just decoration.
The metrics that actually matter share one quality: when they move, somebody does something differently. They prompt a purchase to be delayed, an audit to be scheduled, a maintenance visit to be brought forward, a missing item to be hunted down. This piece is about finding that small, decisive set — and about recognising the seductive figures that feel like progress while quietly telling you nothing.
What makes a metric worth measuring
A good asset KPI answers a question you were genuinely going to act on. Before you track anything, it is worth naming the decision the number serves. If you cannot say what you would do differently when the figure is high versus low, you have found a statistic, not a metric — and statistics are cheap. The discipline is not collecting more data; it is refusing to elevate data that leads nowhere.
There is a deeper reason to be selective. Every metric you display competes for attention with every other, and attention is the scarcest resource in any operation. A dashboard with forty tiles is a dashboard nobody reads, because the important signal is drowned by the trivial. Choosing the few that matter is not a limitation you tolerate; it is the whole point. The measure of a good reporting view is not how much it shows but how quickly it tells you what needs to change.
Asset utilisation: are you using what you own?
Utilisation asks the most basic financial question there is: is the thing you paid for actually earning its keep? An asset sitting idle in a store cupboard costs you exactly as much in capital as one in constant use, and often more in the quiet erosion of depreciation. Tracking how often, and for how long, each asset is genuinely in service turns a vague sense of "we probably have enough" into something you can defend or challenge with evidence.
What makes utilisation powerful is that it points in two directions at once. Consistently low figures reveal assets you could redeploy, share between teams, or dispose of before the next budget cycle — sparing you a purchase you never needed. Consistently high figures, pinned near capacity, are an early warning that demand is about to outrun supply, and that the honest answer to the next request is to buy rather than to squeeze. Read alongside the true total cost of ownership, utilisation stops being a curiosity and becomes the backbone of sensible procurement.
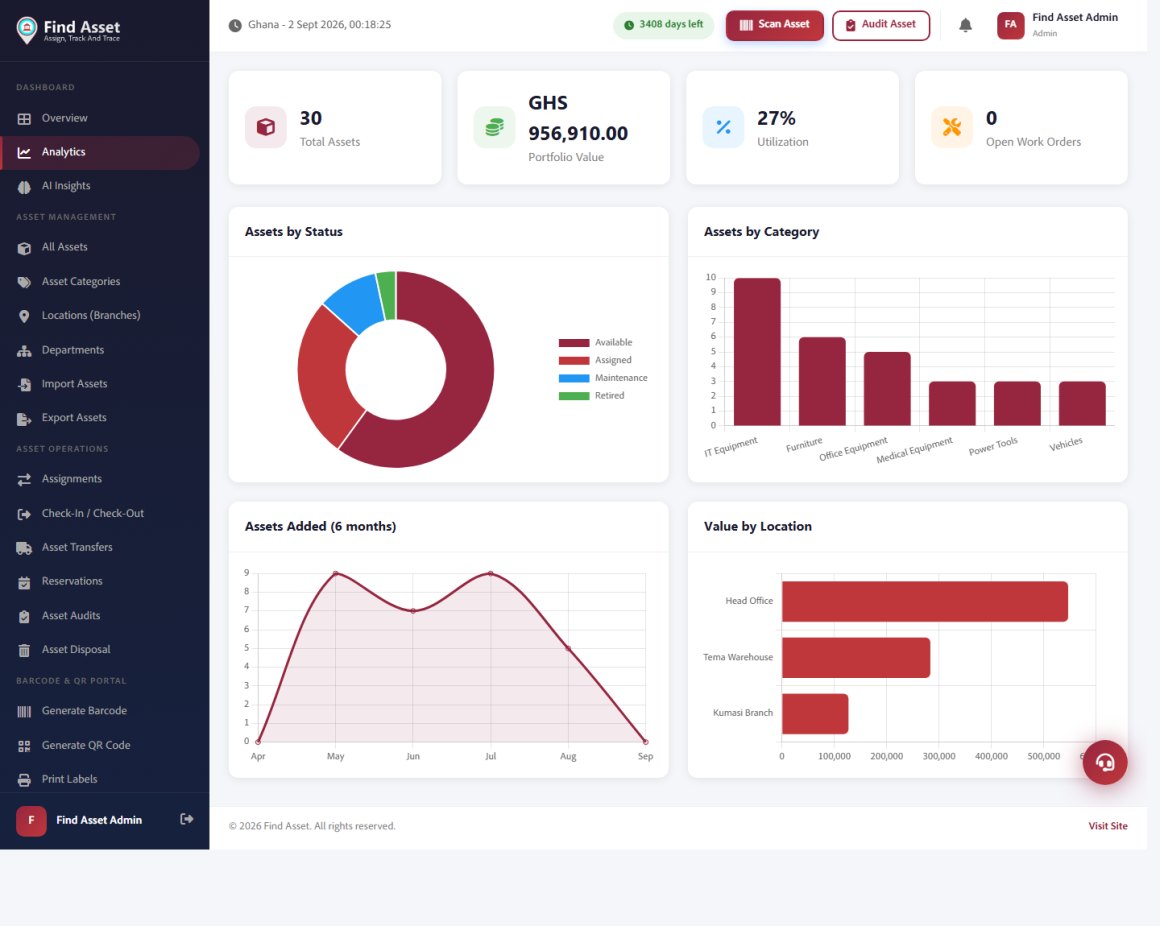
You do not have to build these numbers by hand. The Find Asset analytics screen below reads your live register and plots the KPIs that matter — total portfolio value, utilisation, assets by status and category, additions over time and value by location — updating as your data changes. The metrics in this guide are exactly the ones the software surfaces for you.
Inventory accuracy and the problem of ghost assets
Inventory accuracy is the quiet foundation beneath every other metric, because a register that disagrees with reality poisons everything built on top of it. The classic symptoms are ghost assets — items still on the books that were long ago scrapped, lost or stolen — and their mirror image, the phantom equipment that exists in the corridor but appears nowhere in the system. Both distort your counts, inflate or understate your value, and quietly undermine trust in the numbers.
Measuring accuracy as the share of records that match a physical check gives you a single, honest gauge of how much your register can be believed. A low figure is not merely an accounting nuisance; it is a signal that decisions are being made on fiction. The cure is not heroic effort but rhythm — a habit of reconciliation that keeps the gap between record and reality small enough to ignore. If you have never measured this before, running a first structured audit is the natural place to establish your baseline.
Audit and reconciliation rate
If accuracy tells you how true your register is today, your audit rate tells you how hard that truth is working to stay current. It is the tempo of verification: how much of your estate you physically confirm over a given period, and how quickly discrepancies get investigated and closed rather than logged and forgotten. An accurate register is not a state you reach once; it is a state you maintain, and the audit rate is the maintenance schedule made visible.
The temptation is to treat auditing as an annual ordeal, a frantic count before the accounts close. But a single yearly sweep lets errors accumulate for eleven months before anyone notices, which is precisely when they do the most damage. A steadier cadence — rolling checks that touch high-value or high-movement assets more often — keeps small drifts from hardening into large ones. What you are really measuring here is how much of your data you are willing to vouch for at any given moment.
Mean time to locate and tag read success
Some of the most revealing metrics are the humblest. Mean time to locate — how long it takes someone to actually put their hands on a specific asset — is a direct measure of whether your tracking system earns its place in daily work. When the answer is seconds, because a tag scans and a location resolves, the register is a tool people trust. When the answer is "go and look for it", the system has quietly failed at its one visible job, whatever the dashboard claims.
Closely related is tag read success: the proportion of scans that resolve cleanly on the first attempt rather than failing on a worn label, a poor print or a code that no longer maps to anything. It sounds like a technical footnote, but a falling read rate is often the first tremor of a larger accuracy problem, because every failed scan is a moment where someone gives up and updates nothing. Watching this figure protects the discipline that all your other metrics silently depend upon.
| Metric | The decision it drives |
|---|---|
| Asset utilisation | Redeploy, dispose, or approve new purchases |
| Inventory accuracy | Whether the register can be trusted at all |
| Audit / reconciliation rate | How often to verify and how fast to resolve gaps |
| Maintenance compliance | Prevent avoidable downtime before it happens |
| Mean time to locate | Whether the tracking system earns daily use |
| Loss / shrinkage rate | Where to tighten custody and accountability |
Maintenance compliance and unplanned downtime
For any asset that does real work, the difference between planned and unplanned maintenance is the difference between a routine cost and a crisis. Maintenance compliance — the share of scheduled services that were actually completed on time — is a leading indicator, one of the few metrics that tells you about a problem before it happens rather than after. A slipping compliance figure today is unplanned downtime you have not yet experienced but have already, in effect, ordered.
Its companion, unplanned downtime, is the lagging counterpart: the hours lost when something failed that a timely visit might have prevented. Read together they form a cause-and-effect pair you can genuinely manage, and they turn maintenance from a grudging expense into a visible form of risk control. The connection is the heart of a preventive maintenance approach — you measure compliance precisely because it is the lever that keeps downtime, and its far larger costs, from ever arriving.
Choosing metrics that change what you do
- Name the decision before the metric — if nothing changes when it moves, drop it.
- Favour leading indicators like maintenance compliance over purely historical counts.
- Treat inventory accuracy as the foundation every other number stands on.
- Prefer a few metrics people act on to a dashboard nobody reads.
- Watch humble signals — locate time and read success — as early warnings.
The vanity metrics that quietly mislead
Not every impressive number deserves your attention, and some actively mislead. The total count of assets is the classic vanity metric: it grows, it feels like progress, and it tells you almost nothing about whether those assets are used, maintained or even still present. A large register is not an achievement; it may simply be a large liability that has never been questioned. Beware, too, of raw activity counts — scans logged, records touched — which measure motion rather than outcome and reward busyness over insight.
The tell of a vanity metric is that it only ever moves in the flattering direction and never prompts an uncomfortable action. A genuinely useful figure will sometimes deliver bad news you would rather not hear — an accuracy rate that has slipped, a compliance figure falling short, utilisation revealing money tied up in idle kit. Those are the metrics worth keeping, precisely because they can be wrong in your favour or against it. As with any system of performance indicators, the value lies not in the number itself but in the honest conversation it forces.
Loss, shrinkage and the discipline of custody
Loss and shrinkage — the rate at which assets simply disappear between one count and the next — is the metric no organisation enjoys tracking and every organisation needs. It is uncomfortable precisely because it points at gaps in accountability rather than machines, and because the honest figure is rarely zero. Yet a loss rate you refuse to measure is not a loss rate of zero; it is merely one you have chosen not to see, which is a far more expensive thing to own.
What makes shrinkage worth the discomfort is that it maps directly onto action. A cluster of losses in one location, one category, or one hand-off point tells you exactly where custody is weak and where a clearer sign-out process or a tighter check would pay for itself. Tracked steadily, it stops being an annual shock buried in the accounts and becomes an ordinary operational signal — one that rewards the everyday tracking habits that quietly keep things where they belong.
Bringing it together
The instinct to measure more is understandable, but it is the wrong instinct. The organisations that get real value from asset tracking are not the ones with the busiest dashboards; they are the ones that chose a handful of metrics tied to real decisions and looked at them often enough to act. Utilisation, inventory accuracy, audit rate, maintenance compliance, locate time and loss — six honest numbers will carry you further than sixty flattering ones, because each of them can tell you something you would rather not hear and would be foolish to ignore.
Find Asset is built to surface exactly that decisive set, turning a live register into the few figures that actually move your hand — without the noise that buries them. The best time to define your metrics is before you need them, so that the numbers are already true when a decision arrives. You can start a free 14-day trial and shape a reporting view around the questions your operation genuinely asks, keeping only what changes what you do next. Measured well, an asset register stops being a filing cabinet and becomes something rarer: a quiet, reliable prompt to do the right thing at the right time.